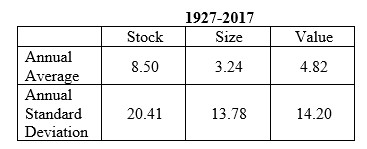


The stock premium—the annual average return of stocks minus the annual average return of one-month Treasury bills—has been high, attracting investors to the stock market. For the period 1927–2017, it averaged 8.5%. There have also been size (return of small stocks minus return of large stocks) and value (return of value stocks minus return of growth stocks) premiums of 3.24% and 4.82%, respectively.
However, the excess returns are generally referred to as risk premiums—they aren’t free lunches. We see evidence of that in the volatility of the premiums. The stock, size and value premiums have come with annual standard deviations of 20.41% (2.4 times the stock premium), 13.78% (4.3 times the size premium) and 14.20% (2.9 times the value premium), respectively.
Let’s take a closer look at some of the data that illustrate the riskiness of the premiums. For the period:
Further Evidence
Eugene Fama and Ken French examined the volatility of the three equity premiums we have been discussing in their December 2017 study “Volatility Lessons,” which covered the period July 1963 through December 2016. In addition to finding high volatility of stock returns, they also found:
Fama and French noted that while most of the news about equity premium distributions for longer return horizons is good, there is bad news. They used the realized monthly returns from the period their study covered to construct long-horizon simulation returns, and found that for the three- and five-year periods that are often the focus of professional investors, negative equity premiums occur in 29% of three-year periods and 23% of five-years periods of simulation runs. Even for 10- and 20-year periods, negative premiums occur in 16% and 8% of simulation runs, respectively.
Fama and French found similar results for the size and value premiums, and concluded that this is simply the nature of risk—if you want to earn the expected (the mean of the distribution of potential outcomes) premiums, you must accept the fact that you will experience losses, no matter how long your horizon. Said another way, if you can’t stand the heat, get out of the kitchen.
They concluded: “The high volatility of stock returns is common knowledge, but many professional investors seem unaware of its implications. Negative equity premiums and negative premiums of value and small stock returns relative to Market are commonplace for three- to five-year periods, and they are far from rare for ten-year periods. Given this uncertainty, investors who will abandon equities or tilts toward value or small stocks in the face of three, five, or even ten years of disappointing returns may be wise to avoid these strategies in the first place.”
Myopic Behavior Kills Returns
In my more than 20 years of providing investment advice, I’ve concluded that most investors —both individual and institutional—believe that when it comes to evaluating investment returns, three years is a long time, five years is a very long time and 10 years is an eternity. However, financial economists know that the historical evidence demonstrates that 10 years can be nothing more than noise and thus should be treated as such.
Most investors lack the discipline required to do so. Thus, they end up being subject to recency, which results in buying after periods of strong performance (when valuations are high and expected returns are low) and selling after periods of weak performance (when valuations are low and expected returns are high). That’s not a prescription for investment success. It is also why Warren Buffett says his favorite investment horizon is forever.
Before concluding, it’s important you understand we cannot be certain of the investment risks (the odds of negative premiums) we have been discussing. That should make us less confident about earning premiums, meaning the odds of not earning the premiums may be higher than our estimates.
In other words, at best we can only estimate the odds of experiencing negative premiums—we cannot know them. That helps explain why the premiums have been so large. Investors don’t like uncertainty and demand large ex-ante premiums as compensation. They dislike even more owning assets that tend to do poorly during bad times, when their labor capital is put at risk. And that’s exactly when the three premiums tend to turn negative. Together, these two issues provide the explanation for the large size of the three risk premiums.
Two more important points we need to cover both relate to the diversification of risk. First, the odds of earning the premiums are based on portfolios that are highly diversified. For more concentrated portfolios (like those of the typical actively managed fund or the typical individual investor buying individual stocks), uncertainty about outcomes is higher. That is another reason why active investing is called the loser’s game.
Second, there is a very low correlation of the three risk premiums. From 1964 through 2017, the annual correlation of the size and value premiums to the stock premium has been just 0.26 and -0.25, respectively, and the annual correlation of the size and value premiums is close to 0 (0.02). That makes them effective diversifiers of portfolio risk, a type of diversification not achieved by investors whose portfolios are limited to total market portfolios.
This is an issue that many find difficult to understand. Here is a brief, and hopefully helpful, explanation. It’s true that total market portfolios own small and value stocks, providing positive exposure to the premiums. However, they have no net exposure to the size and value premiums because their holdings of large and growth stocks provide negative exposure to the premiums—exactly offsetting the positive exposure provided by the small and value stocks.
Summary
The bottom line is that when developing your investment policy statement, you must be sure that your portfolio doesn’t take more risk than you have the ability, willingness and need to take. You must also be sure that you understand and accept the nature of the risks you are going to have to live with over time. The appropriate warning is that most battles are won in the preparation stage, not on the battlefield.
If you don’t understand the nature of the risks, when they do show up, you will be unable to keep your head while all about you are losing theirs, and it’s far more likely your stomach will take over. And I’ve yet to meet a stomach that makes good decisions. The result will likely be that your well-developed plan will end up in the trash heap of emotions. Forewarned is forearmed.
Next, we’ll take look at the two premiums related to bonds: term and default.
This commentary originally appeared October 3 on ETF.com
Note: Data presented in this blog is from Kenneth French’s website.
By clicking on any of the links above, you acknowledge that they are solely for your convenience, and do not necessarily imply any affiliations, sponsorships, endorsements or representations whatsoever by us regarding third-party Web sites. We are not responsible for the content, availability or privacy policies of these sites, and shall not be responsible or liable for any information, opinions, advice, products or services available on or through them.
The opinions expressed by featured authors are their own and may not accurately reflect those of the BAM ALLIANCE®. This article is for general information only and is not intended to serve as specific financial, accounting or tax advice.